
Genomic surveillance of SARS-CoV-2
Updated: 1.7.2025
The evolution of SARS-CoV-2 viruses has been monitored in Finland through whole genome sequencing since December 2020. Whole genome sequencing is applied for timely identification of the viral uslineages circulating in the population and the mutations occurring in them.
THL is responsible for the national genomic surveillance of SARS-CoV-2 in Finland. Wellbeing service counties and laboratories conducting coronavirus diagnostics provide a weekly sample of PCR positive SARS-CoV-2 samples for sequencing. The sequence data produced for viral genomic surveillance purposes does not contain any identifying information.
The genomic surveillance data is reported to the National Infectious Diseases Register with an approximately 2-week delay from sample collection.
The sequence data produced in Finland is combined with global SARS-CoV-2 datasets which are used to identify emerging and potentially pandemic variants and to monitor regional changes in sublineage prevalence. Based on the sequence data, viruses are also selected for further laboratory investigations at THL, for example for studies assessing the ability of the viruses to evade immunity.
Information based on the sequencing results and on the national infectious diseases register may differ slightly due to registry reporting delays. Results for the last reporting week are often based on a relatively small number of samples and are therefore less reliable than data for the previous weeks.
- Detected coronavirus variants in wastewater
- WHO and ECDC maintain lists of variants of interest (VOI) and variants under monitoring (VUM) with the objective to investigate if these lineages may pose an additional threat to global public health as compared to other circulating viruses.
Tracking SARS-CoV-2 variants (WHO)
SARS-CoV-2 variants of concern (ECDC) - You can view global data on SARS-CoV-2 sublineages around the world on the Nextstrain website.
Genomic epidemiology of SARS-CoV-2 (Nextrain.org)
Overview, summer 2025
Sequenced SARS-CoV-2 variants are sublineages within BA.2.86 JN.1. The currently most common sublineages are LP.8.1, NB.1.8.1 and XEC. The results correspond to trends reported from other countries in Europe.
The evolution of SARS-CoV-2 lineages is expected to continue through mutations that confer improved evasion of the population immunity. According to WHO´s assessment, the currently circulating variants do not significantly differ in their public health impact compared to previous variants.
Contents
- Tabell 1. Proportions (%) of observed SARS-CoV-2 sublineages among sequenced samples in Finland
- Figure 1. Weekly distribution of observed SARS-CoV-2 sublineages
- Figure 2. Weekly number of variants of concern recorded in the national infectious diseases register, from December 2020 onwards
Tabell 1. Proportions (%) of observed SARS-CoV-2 sublineages among sequenced samples in Finland
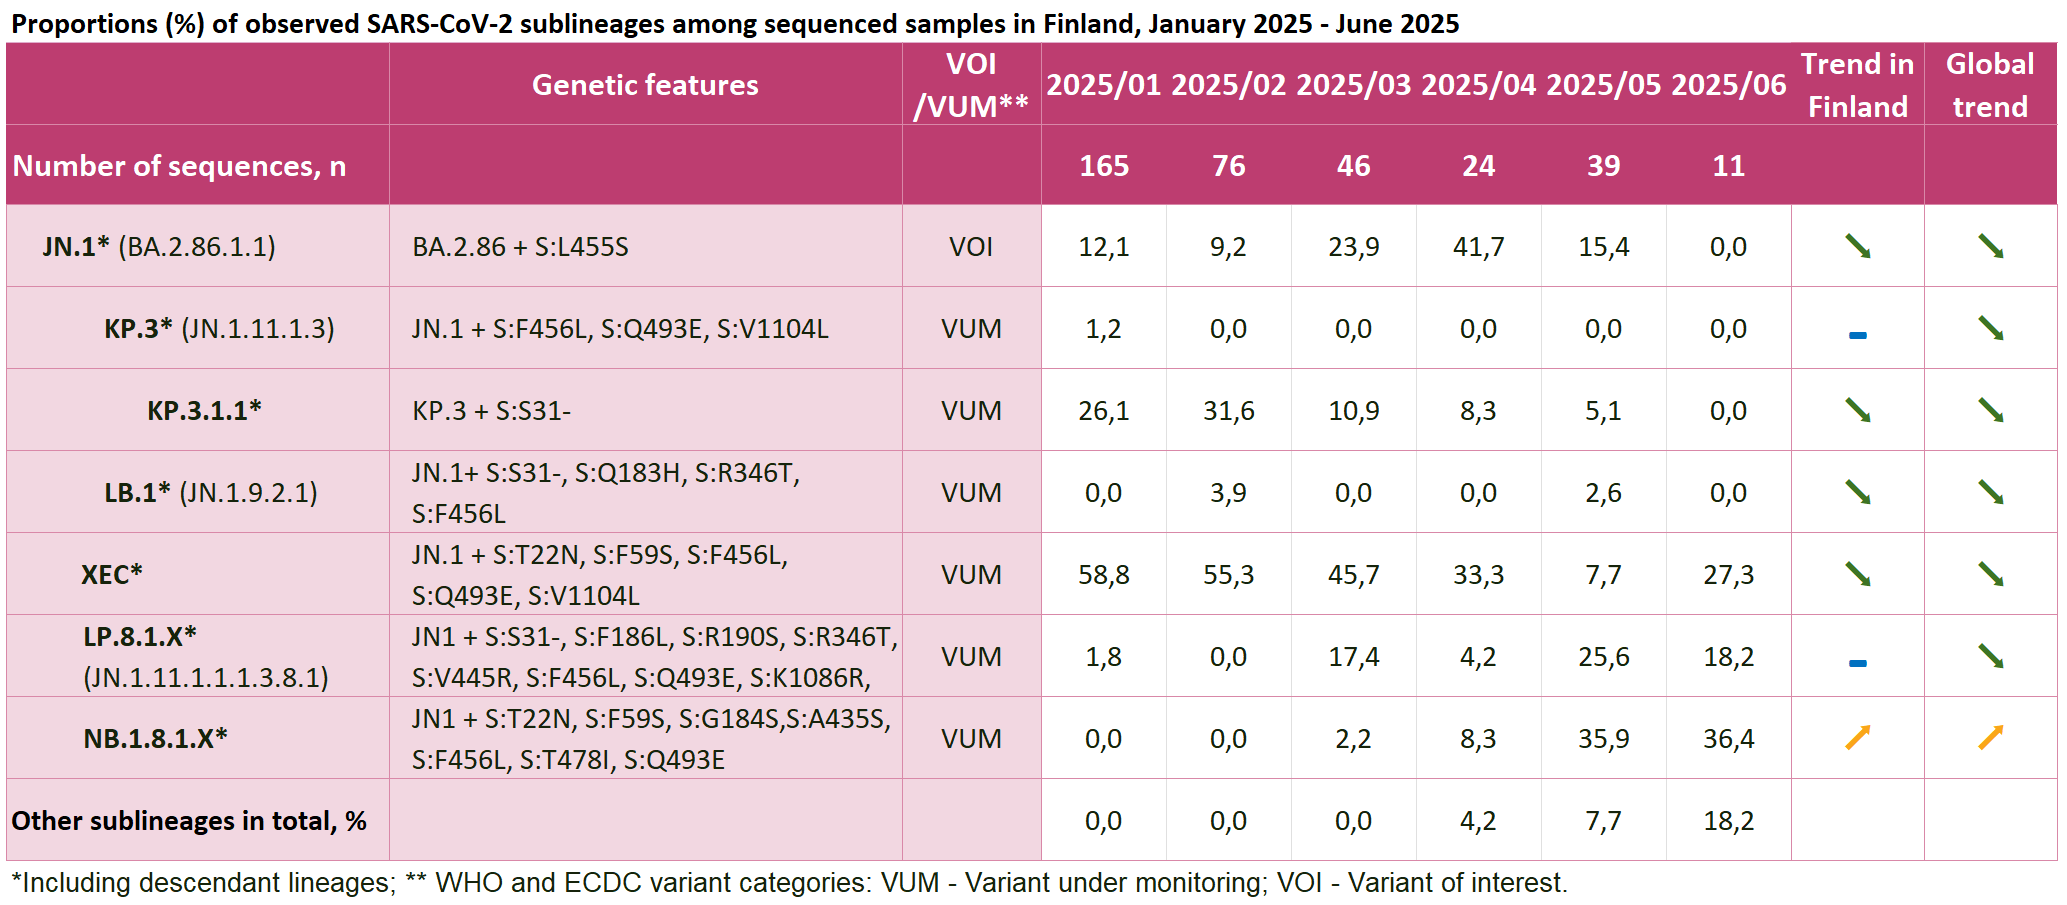
Click on the image to enlarge (png, 274 KB).
Tabell 1 in an accessible table format (csv, 1 KB)
Figure 1. Weekly distribution of observed SARS-CoV-2 sublineages
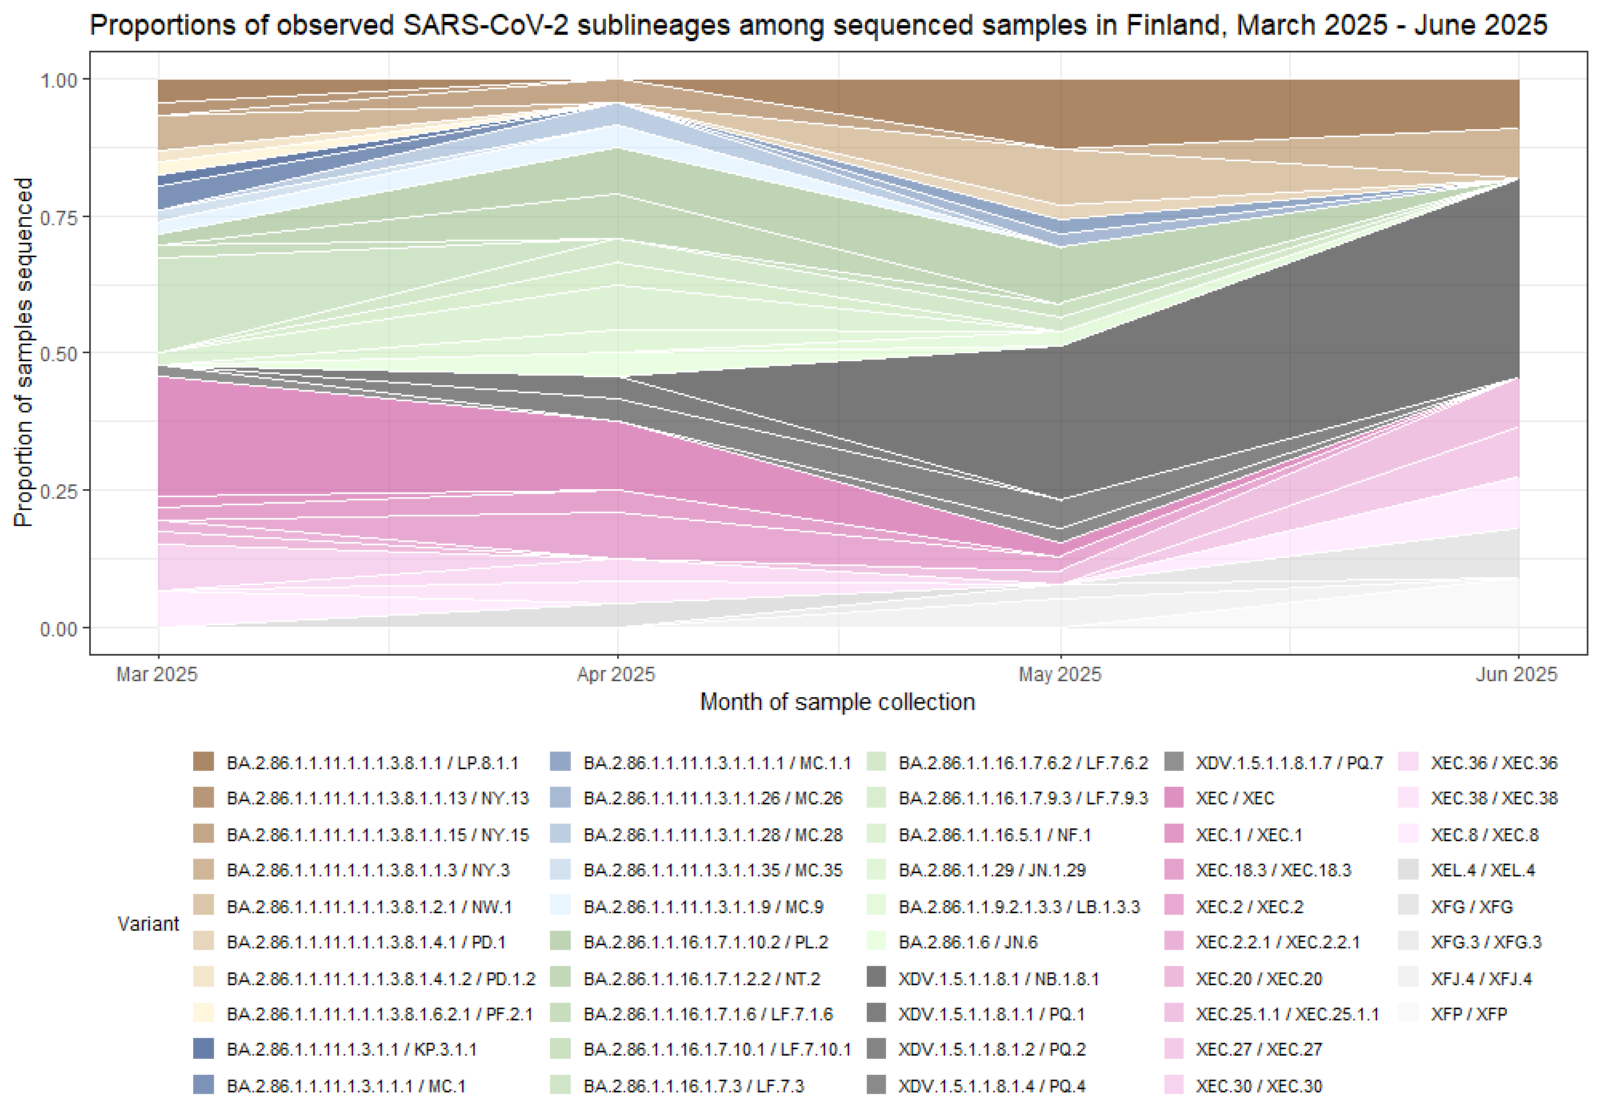
Figure 1 in an accessible table format (csv, 2 KB)
Figure 2. Weekly number of variants of concern recorded in the national infectious diseases register, from December 2020 onwards
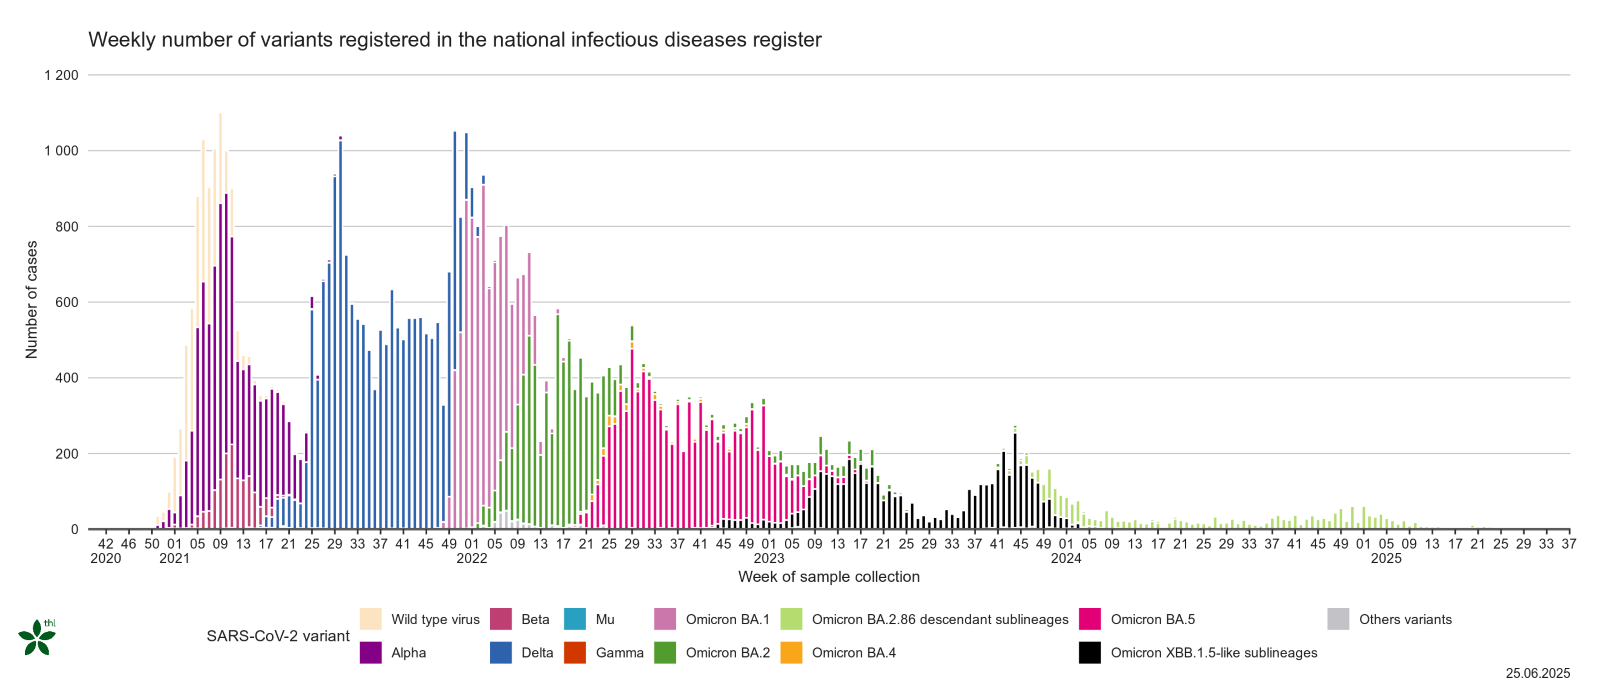
Click on the image to enlarge (png, 94 KB). The graph displays the weekly number of variants of concern (VOC) in the national infectious diseases register, from December 2020 onward when the national genomic surveillance for SARS-CoV-2 was initiated.