
Equality infographics on employment
From this page you can find visualized information about the state of equality in working life and education in Finland. The infographics are meant to strengthen the data basis on the state of equality as well as raise awareness on issues regarding equality, which disable achieving equality and equity in working life.
The infographics include intersectional analyses according to gender (women/men) and origin (Finnish and foreign-born), level of education and country of origin. Gender data comes from the national register.
The infographics are freely accessible. You can download and utilize them as a part of your presentation, social media posts, reports and other publications.
The infographics have been divided to three pages:
- Equality infographics on employment (this page)
- Equality infographics on work-life segregation
- Equality infographics on education
The equality infographics on employment
Share of employed and unemployed people in Finland by gender and background
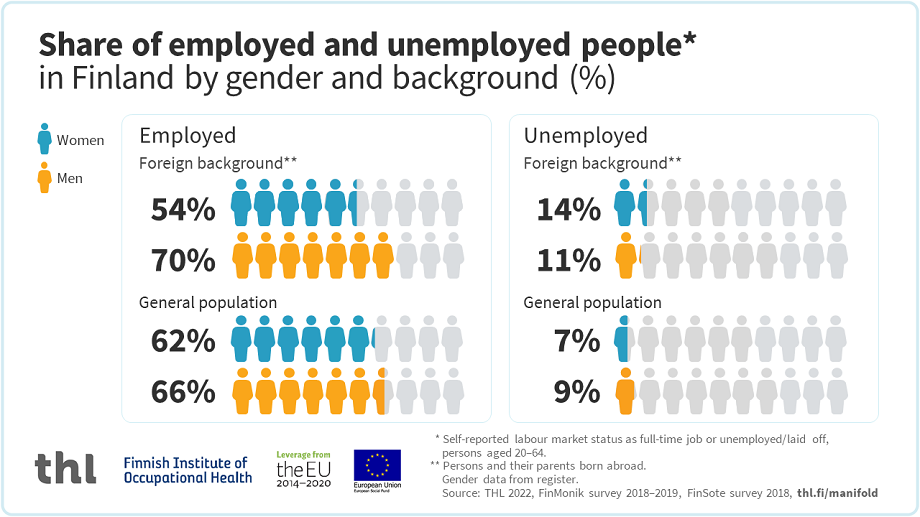
54 percent of women and 70 percent of men with a foreign background are employed. Of the general population, 62 percent of women and 66% of men are employed. 14 percent of women and 11 percent of men with a foreign background are unemployed. Of the general population, 7 percent of women and 9 percent of men are unemployed.
Share of employed people in Finland by gender and background
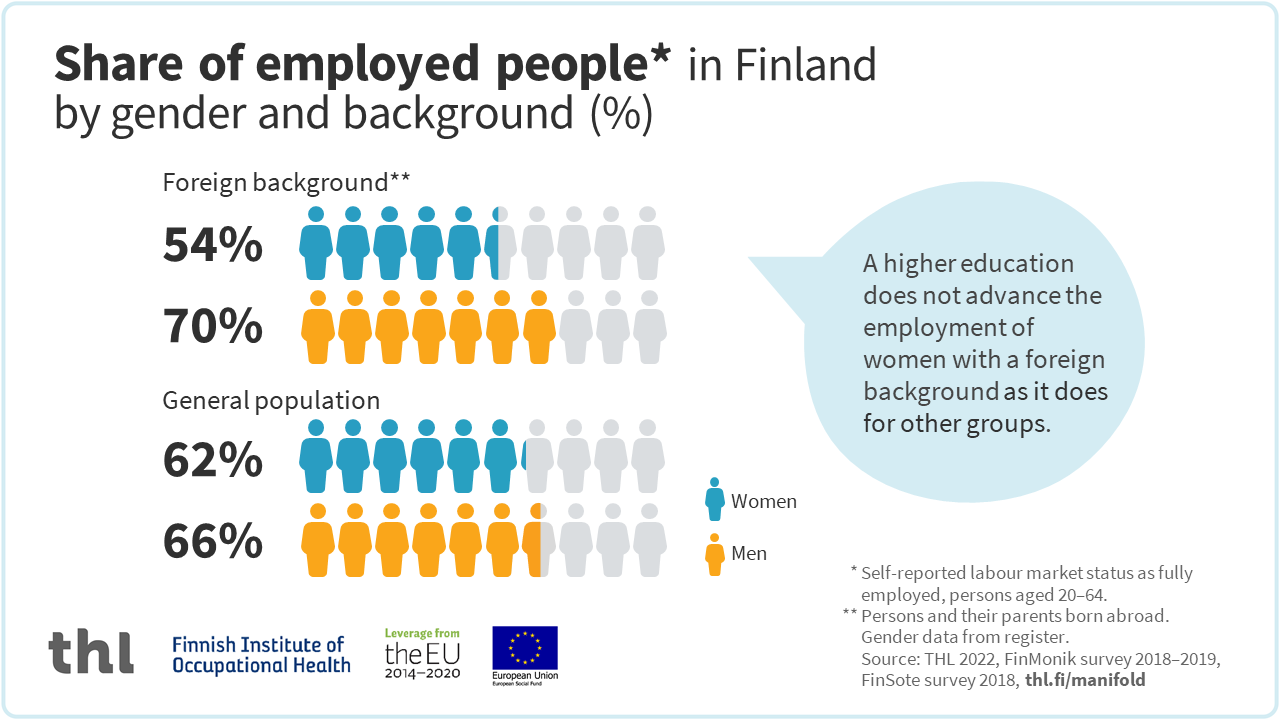
54 percent of women and 70 percent of men with a foreign background are employed. Of the general population, 62 percent of women and 66 percent of men are employed. A higher education does not advance the employment of women with a foreign background as it does for other groups.
Share of unemployed people in Finland by gender and background
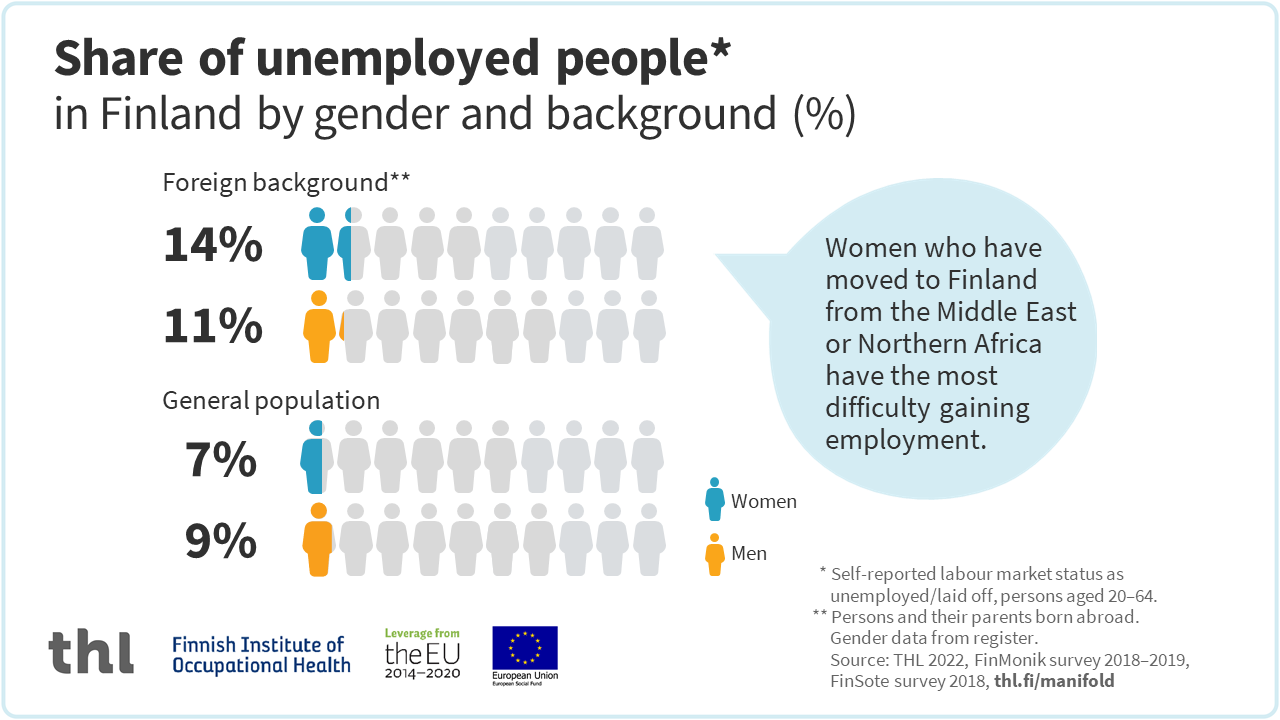
14 percent of women and 11 percent of men with a foreign background are unemployed. Of the general population, 7 percent of women and 9 percent of men are unemployed. Women who have moved to Finland from the Middle East or Northern Africa have the most difficulty gaining employment.
Share of people with a foreign background in fixed-term employment in Finland
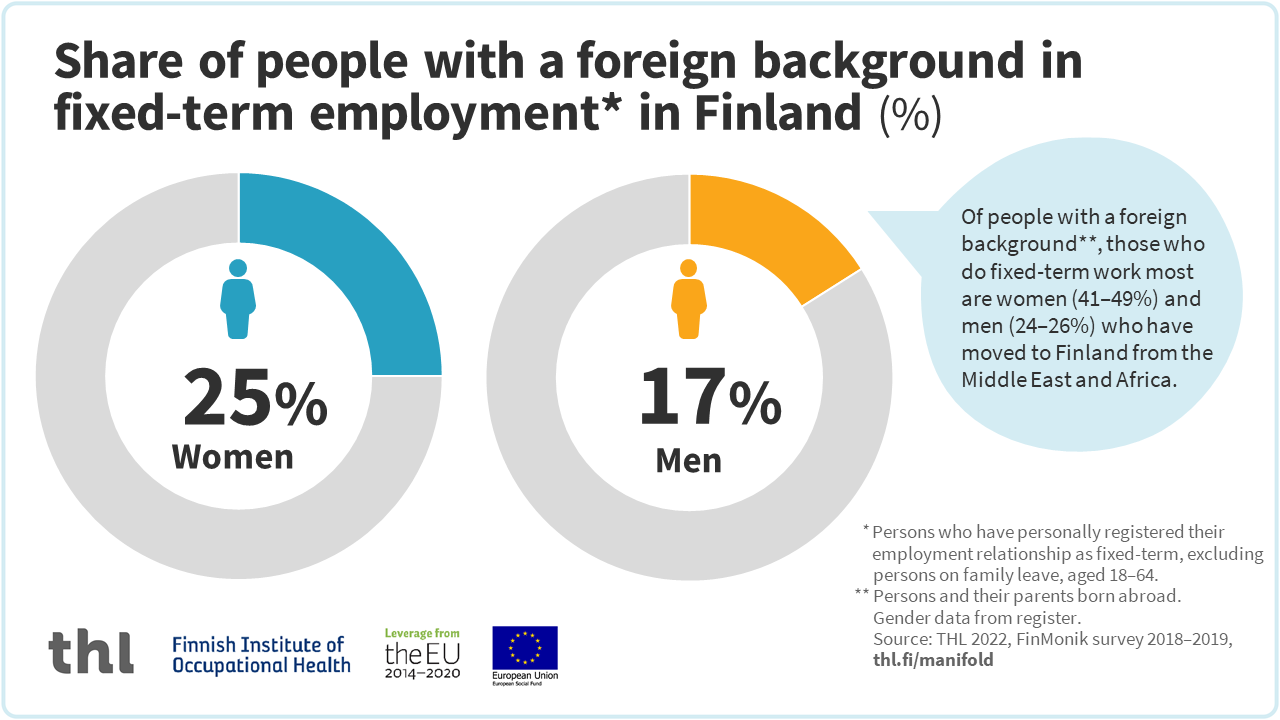
25 percent of women with a foreign background work in fixed-term employment. The corresponding share of men is 17 percent. The people who do fixed-term work most are women (41–49%) and men (24–26%) who have moved to Finland from the Middle East and Africa.
Share of part-time employed people by gender and background in Finland
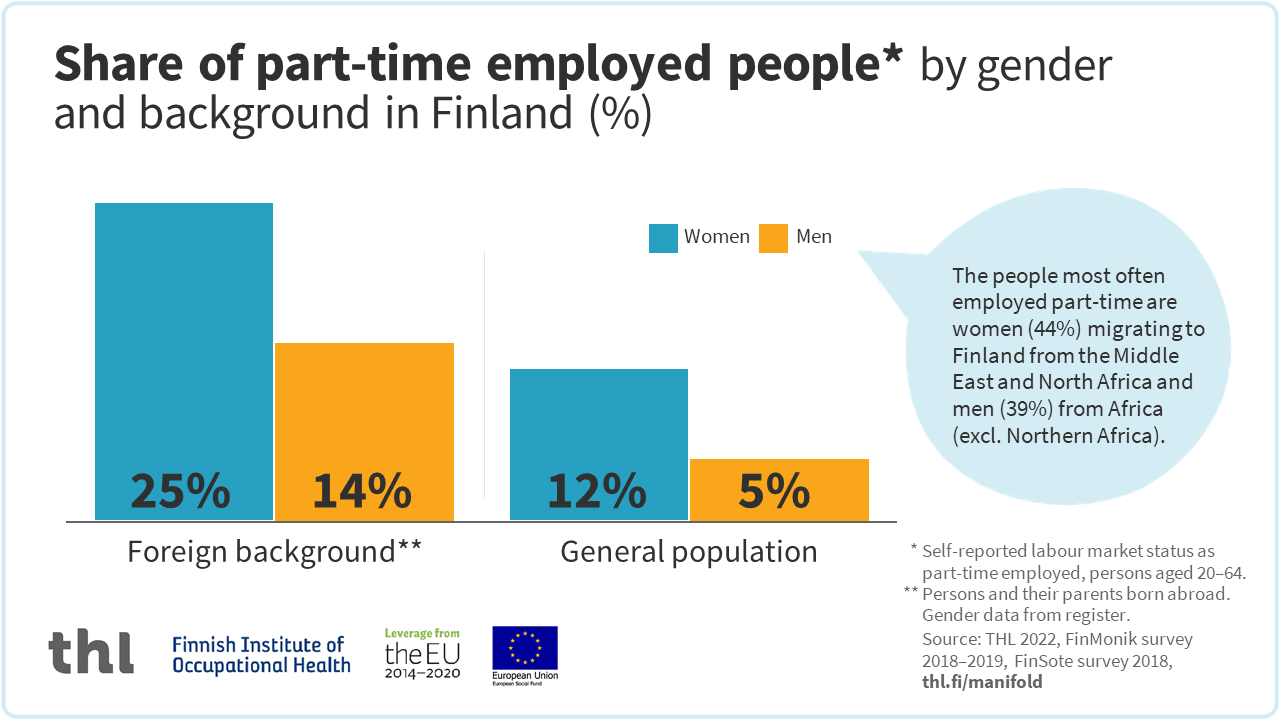
25% of women and 14% of men with foreign backgrounds are part-time employed. Of the general population, 12% of women and 5% of men are part-time employed. The people most often employed part-time are women (44%) migrating to Finland from the Middle East and North Africa and men (39%) from Africa (excl. Northern Africa).
Sources
The equality infographics were chosen based on the views of the state of equality and central issues regarding equality by equality and non-discrimination experts as well as the goals of Manifold More project (ESF) between 2019–2022.
The infographics were produced in European Social Fund (ESF) funded project Manifold More (2019–2022).
Manifold more - Leverage to the professional careers of immigrant background women
Survey on Well-Being among Foreign Born Population: FinMonik research 2018–2019 (in Finnish)


