You can study database reports on different topics using THL's User Interface for Database Cubes and Reports (TIKU). Data are available in the form of data cubes and database reports.
Database reports are ready-made compilations of key data on a subject area.
They have less customisation options for the user and are easy to use.
Data cubes enable more versatile data analyses.
There are several customisation options available for users covering, for example, the entire dataset for a subject area.
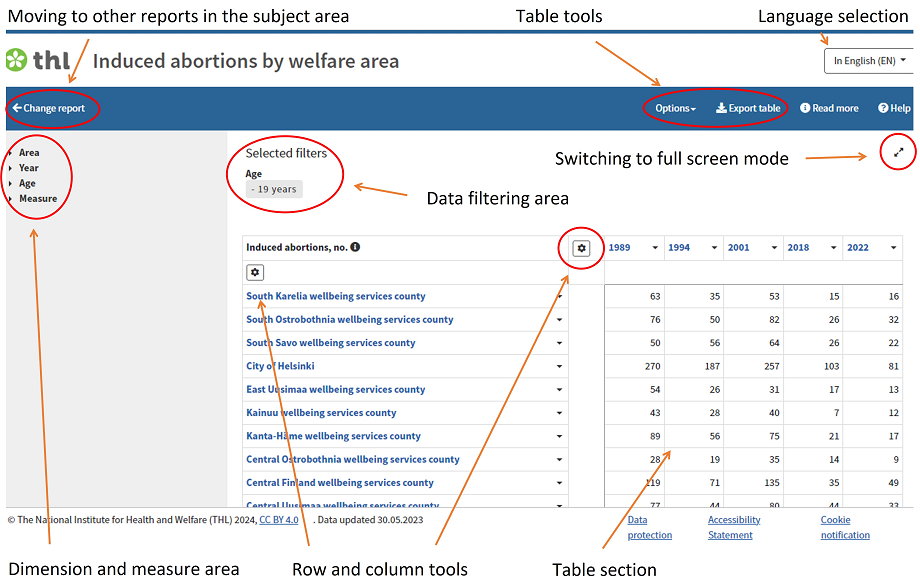
The available dimensions and measures are listed in the grey area on the left; from this area you can drag dimensions and measures to the selected filters or to the table.
Use the drop-down menus in the blue area on the top to export data and to customise the table. The Change report link will take you to the database reports (if they are defined) and to any other cubes in the subject area. Click the Read more link to find out more additional information about database on relevant page in the thl.fi service or another online service.
Clicking on the icon in the upper right corner (arrows pointing in different directions) will switch the table section to full screen mode.
In the top left corner of the table section you will find the tools to customise the table rows and columns.
The selected filters will be displayed above the table section once you have selected a filter by dragging a dimension or a measure to the filter area.
For multilingual cubes the language options are listed in the top right corner.
Navigating in the user interface for data cubes
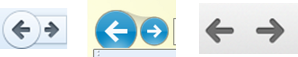
Use the browser’s own browsing buttons to return to previous views.
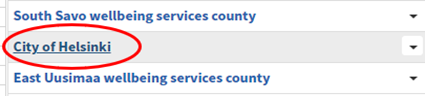
Click the row and column headers to drill down to lower levels.
Move the pointer tool on top of the row or column header. The link is underlined.
Click the link.
The creator of the cube has been able to define and name the default view and other ready-made views. Otherwise, in the default view table the first dimension is displayed in the rows, the second dimension in the columns and the first measure as the table header.
You can return to the default view using the table tools.
Select Options – Reset view.
Other possible ready-made views can also be found in the Options menu.
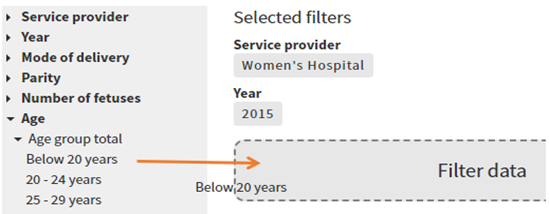
Filtering data
Dimension data can be filtered by dragging the desired dimension to the filter area.
Open a dimension in the grey area on the left by clicking the dimension header.
Open lower levels by clicking the header of the dimension’s highest level.
One dimension can contain several levels. Black arrow at the end of the dimension header indicates that the dimension contains at least one lower level.
Use the pointer tool to drag the desired dimension category from the grey area to the filter area on top of the table section.
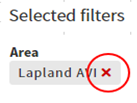
Removing filters.
Move the pointer tool on top of the dimension in the filter area. A red cross will appear.
Click the red cross.
You can select several filters, but only one filter per dimension. Dragging a second category from a dimension to the selected filters replaces the first selection.
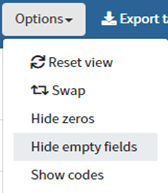
Filtering data may result in empty rows or columns in the table; you can always hide the empty fields.
Select Options – Hide empty fields.
You can always redisplay the empty rows and columns.
Select Options – Show empty fields.
Switching a measure
In the default view, the first measure available is shown as the table header. The measure name is displayed on the left top corner of the table.
The Measures folder is the last item in the list of dimensions and measures in the grey area on the left. A measure may have subfolders or all the measures may be in the same folder.
You can swap a measure by dragging another measure to the filter area.
Open the measures list in the grey area on the left by clicking the Measures folder.
Open lower levels by clicking the highest level in the Measures folders.
A measure may have several levels of folders. Open the lowest level. The lowest level of a measure does not have a black triangle to the left of the measure name.
Use the pointer tool to grab a new measure in the lowest measure level.
Drag the measure to the filter area on top of the table.
The measure is swapped and the name of the new measure is displayed on the top left corner of the table.
Customising the table section
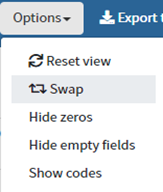
You can swap rows and columns in the table.
Select Options – Swap.
You can add a dimension or a measure into the table rows or columns by dragging your selection to the table section. You can only add your selection inside the row or column.
Open a dimension or the Measures folder in the grey area on the left by clicking the dimension header or the Measures folder.
Open lower levels by clicking the header of the highest level.
Open yet another level if necessary by clicking the header of levels with a black arrow.
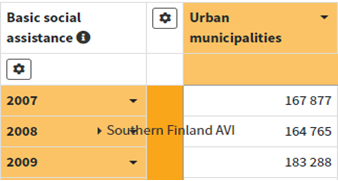
Grab a dimension category, a measure or the Measures folder with the pointer tool and drag your selection to the table section in the area indicated by the +- sign.
When the target area turns deep orange the dragged selection is in the correct place and you can release it.
You can replace a dimension in the table rows or columns by dragging your selection to the table section of your choice.
Open a dimension or the Measures folder in the grey area on the left by clicking the dimension heading or the Measures folder.
Open lower levels by clicking the header of the highest level.
Open yet another level if necessary by clicking the header of levels with a black arrow.
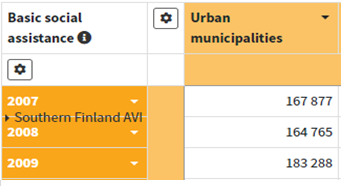
Grab a dimension category, a measure or the measure folder with the pointer tool and drag your selection to the table section on top of the dimension you want to replace.
When the target area turns deep orange the dragged selection is in the correct place and you can release it.
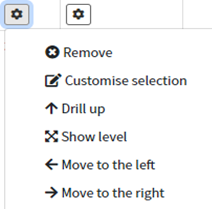
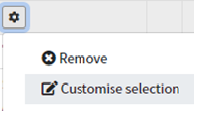
Click the Gear icon at the start of the rows and columns to open the tool menu for the rows and columns. The menu shows only the options available for the selected row or column.
Remove: Remove a dimension from the table section
Customise selection: Open the selection window for the rows or columns
Drill up: Return to a higher level in the dimension
Move up/down/to the left/to the right: Move the location of a row or a column
Expand: Expand to a new column/row from a lower level dimension
Show level: Show all the rows/columns on the same level of a dimension or a measure
Row and column selections
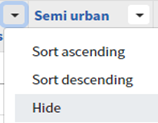
You can hide a single row or column using the menu for the row or column.
Click the downward arrow at the end of the row or column header. The menu opens.
Select Hide.
You can use the Gear icon at the head of the rows or columns to open a new window that allows you to customise your row and column selections.
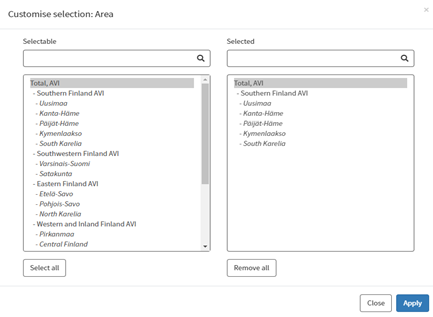
Click the Gear icon for the rows or columns and select Customise selection. A new window opens.
Make your selections in the child window.
Add rows/columns by clicking once on the desired selectable option in the child window on the left.
Hide rows/columns by clicking once on the desired selected option in the child window on the right.
Add all rows/columns by clicking the Select all icon.
Hide all rows/columns by clicking the Remove all icon.
Use the search function in the child windows. The search tool displays only those rows/column that contain the entered character string. Select the desired options from the search results.
Confirm your selection by clicking the Apply icon, or discard your selection by clicking the Close icon.
Sorting data
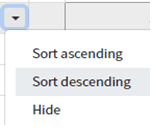
Sorting data in columns: Click the downward arrow in the column header cell and select Sort ascending or Sort descending
Sorting data in rows: Click the downward arrow in the row header cell and select Sort ascending or Sort descending
Exporting data
You can export data in PDF, Excel and CSV file formats. The selected filters, sorting of data and hiding of zeros will also be exported.
Select Export table from the table toolbar.
Select one of three options: In CSV file format, In Excel format or In PDF format.
Bookmarks
Add bookmarks to the cube view using the browser’s own tools. Each cube view has its own unique address as shown in the browser address bar. If you do not rename your bookmark, all the bookmarks for the same cube will have identical names.
The bookmark will be available even after data updates as long as there are no changes in the cube structure or the measure/dimension references. You can use the bookmark as a link. Different browsers have different options for adding bookmarks. Below are a couple of examples, but check your browser instructions for more information.
Chrome:
Click the Star icon at the end of the address bar.
Name the bookmark by entering the name in the Name field.
Click Done.
To turn the bookmarks bar on, click the menu in the top-right corner of the browser window and select Bookmarks – Show Bookmarks Bar.
Internet Explorer:
Click the Star icon.
Select Favorites – Add to Favorites
Name the bookmark by entering the name in the Name field.
Click Add.
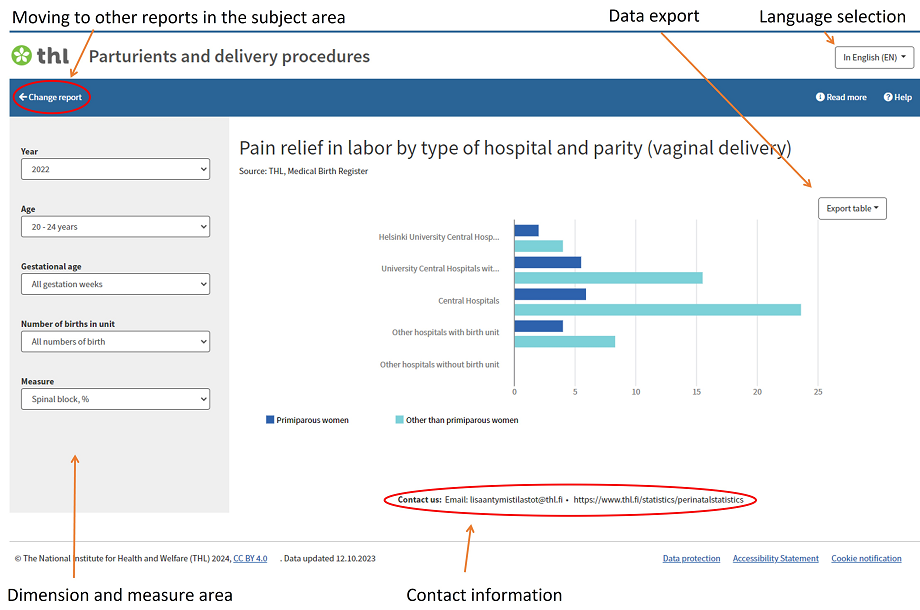
How to use the user interface for database reports
Navigating in the database report
Use the browser’s own buttons to navigate forward and backword in a database report.
A measure may have several levels of folders. Open the lowest level. The lowest level of a measure does not have a black triangle to the left of the measure name.
You can even drill down in the database reports by clicking on the row or column header links in tables and by clicking on a column in figures. In the tables, the header link is displayed in blue and is underlined when you move the pointer over it. In the figures, the pointer becomes a hand instead of an arrow if drilling down is possible.
Return to the previous level using the breadcrumb trail on top of the database report.
Database report options
In database reports you can make your selections in the grey area on the left.
You can make a single selection using to drop-down menu: open the menu by clicking on the arrow, scroll down the menu and click on the item you want to select.
You can also make a multiple selection: Click the Customise selection button to open a new window that allows you to customise your selections.
Exporting data from database reports
Export a single image or table in the database report into CSV file, Excel file or an image. The option of exporting the figure as an image is not available in Internet Explorer.
Select Export table – In CSV file format/In Excel format/As an image.
More information about the topic of the database report
Click the Read more link to find out more about the topic of the database report. The link will take you to the relevant page in the thl.fi website or some other website.
Bookmarks in database reports
Add bookmarks/favourites in the database report view using the browser’s own tools.
More functions by pointing
By pointing different elements in the figure you get floating text items containing numerical values, measure names or a definition.
By pointing a colour in the figure label you get a new figure showing only the data for that item in the figure. The other sections are transparent.
Language options
For multilingual database report the language options are listed in the top right corner.
Information about the application
The TIKU user interface for data cubes and database reports has been developed by the National Institute for Health and Welfare (THL).
The user interface was taken into production use on 8 April 2016.
The user interface adjusts to different screen sizes.
TIKU works in all the most popular browsers.
One function is different in different browsers.
The option of exporting data as an image from the database report is not available in Internet Explorer.
Send feedback on the TIKU user interface to tietojarjestelmat(at)thl.fi.
.png/bf871d29-6f3f-70d0-481a-d00bfce5a1fc?t=1708352755437)
.png/7ba36fb3-3cd8-94f4-f30b-be6ae97f7c30?t=1708352796966)
.png/496e9f72-03d8-33f4-fe83-d6bf0a953587?t=1708352857422)

.png/77570f87-1d43-0804-3dcc-b5f2711283af?t=1708353382160)


.png/a6b560c1-159f-dce4-ef88-46af8b0c9818?t=1708354817034)